 Beasts of the East we can call them. And no, unlike what was projected in the preseason, we are not talking about the Bulls or Cavaliers.
The Toronto Raptors (16-6) have been one of the more interesting teams to follow this season.
 Their place atop the Eastern Conference standings and the sixth-best record in the NBA is made all the more impressive by the fact that in a league where the best teams usually have at least one superstar, generally a multi-time All-Star, this roster has a combined total of one career All-Star game appearance (DeMar DeRozan).
They also have gained a superb fan following as “We The North” currently lead the NBA in attendance – a category in which they ranked 17th in the league just three years ago.
Advanced analytics gurus such as myself were very curious to see how the Raptors would adjust to life without the normally durable DeRozan, who had led the team in scoring at 19.4 points per game through 16 games before suffering a gruesome groin injury on Dec. 28 against the Mavericks.
This curiosity stemmed from the fact that despite his standing as the leading scorer on one of the league’s best teams, the Raptors had nearly the same offensive rating (points per 100 possessions) when he was on the court versus when he was not (111.1 to 109.9), and actually had a worse defensive rating (points allowed per 100 possession) when he was on the court versus when he was not (102.0 to 98.4). When you aggregate it, the Raptors were actually 2.4 points per 100 possessions worse when DeRozan was on the court than when he was not, although either way the Raptors had at least a +9.1 point net rating per 100 possessions.
Raptors Offensive and Defensive Ratings When DeRozan Is/Isn’t On Court
Rating = Points Scored/Allowed Per 100 Possessions
| Split | Offense | Defense | Net |
| DeRozan on court | 111.1 | 102.0 | +9.1 |
| DeRozan off court | 109.9 | 98.4 | +11.5 |
| Net DeRozan on court | +1.2 | -3.6 | -2.4 |
Based on this data in DeRozan’s absence, I would have expected the Raptors to be around the same or slightly worse offensively, but potentially better defensively. As it turns out, their offensive rating has actually improved by 3.7 points per 100 possessions, but they have been anything but better on defense. They were the 9th best team before DeRozan’s injury in terms of defensive rating, and in the period between Nov. 28 and today they have been the second worst team in the NBA, barely ahead of the Jazz. Take a look:
Raptors Offensive and Defensive Ratings Pre/Post DeRozan Injury
Rating = Points Scored/Allowed Per 100 Possessions
| Games | Record | Offensive Rating (rk) | Defensive Rating (rk) |
| Games 1-16 (pre DeRozan injury) | 13-3 | 110.7 (2nd) | 100.9 (9th) |
| Games 17-22 (post DeRozan injury) | 3-3 | 114.4 (2nd) | 114.0 (29th) |
When I ran a t-test for statistical significance, it showed that the 13.1 point per 100 possession drop in defensive rating was very statistically significant (almost zero likelihood of it being due to chance), whereas with the increase in offensive rating the probability of this being due to chance is around 50%. Because the only major personnel change between these two splits was the DeRozan injury, it’s clear that something happened to the way the Raptors have adjusted to DeRozan being out of the lineup that is causing a serious lapse on defense.
The best way to disaggregate the Raptors’ defensive rating into smaller pieces in order to try and find a culprit, or culprits, is to think of the defensive rating in terms of what analysts call “Four Factors.”
These factors were first coined by Dr. Dean Oliver, a brilliant former (pre NCAA sanction) Cal Tech basketball player in the 1980s who currently is employed by the Kings and previously worked for the Nuggets and Sonics (if you want to read the bible of this stuff, check out his book on Amazon). For those who are not familiar – below is a summary of these factors, their weights, and how they are calculated. The “Four Factors” relate back to the defensive ratings I’ve mentioned above, in that if you create a weighted average of ranks based on each team’s ranks in these areas, it correlates pretty closely with defensive rating.
| Factor | Approximate Weight/Importance | Calculation |
| Opponent Shooting (effective field goal percentage or eFG%) – more weight is given in the numerator for a made three pointer | 40% | (FGM + .5*FG3M)/FGA |
| Opponent Turnovers (turnover rate is turnovers per possession) | 25% | FGA – OR + TO + .4 * (FTA) |
| Opponent Offensive Rebounding (offensive rebounds per rebound offensive rebound opportunity) | 20% | OREB / (OREB + Opponent DREB) |
| Opponent Getting to the Free Throw Line (free throw rate, which is free throw attempts per field goal attempt. This is seen by Oliver as a more variable skill than the ability to actually make free throws) | 15% | FTA / FGA |
One of the great features of the NBA.com/stats portal is that it allows you to look at lineup statistics in terms of “Four Factors.” This reveals some pretty interesting things as it relates to the Raptors. Perhaps the most interesting thing is to compare the defensive four factors for the Raptors pre/post DeRozan injury starting lineups.
Defensive “Four Factors” Ratings for Raptors Starting Lineups Pre/Post DeRozan Injury
| Lineup | Opp eFG% | Opp FTA Rate | Opp TO Ratio | Opp OREB% |
| PG: LowrySG: DeRozanSF: RossPF: A. JohnsonC: Valanciunas | 50.4% | 0.247 | 12.6 | 19.6% |
| PG: LowrySG: VasquezSF: RossPF: A. JohnsonC: Valanciunas | 57.2% | 0.234 | 12.1 | 24.5% |
 Raptors opponents had a significant increase in opponent effective field goal percentage (the most important factor), marginal improvements in opponent’s free throw rates and turnover rates and a decently large increase in offensive rebounding rate. The only difference from a personnel perspective between these two lineups is Greivis Vasquez in place of DeRozan.
Vasquez, a point guard by trade, started in place of DeRozan at shooting guard in every game except the most recent one against Cleveland, in which he had the flu. Prior to DeRozan’s injury, the Raptors were actually 8.7 points per 100 possessions better defensively when Vasquez was in the game. But 77.4% of those minutes were at point guard (which I defined as minutes when Vasquez was in the game and when Lowry was sitting). When Vasquez was thrown into action as a starting shooting guard (overall Vasquez had the biggest minutes increase – going from 18 to 28 minutes per game), the lineup itself clearly suffers in the most important “factor,” which is opponent effective shooting percentage.
Digging further, this is where the NBA’s new SportVU data can come into play. In these breakdowns, a negative value in the Diff% category is an indicator of good shot defense – it means that opponents shoot that much worse when Vasquez is defending than when he is not.
*Vasquez (post De-Rozan injury) Shot Defense
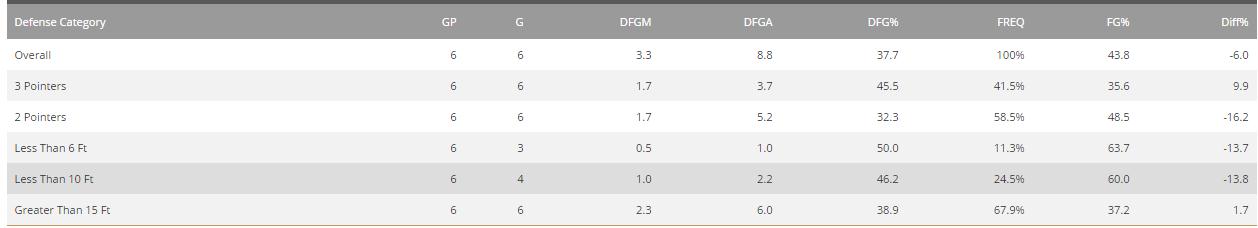
*DeRozan Shot Defense
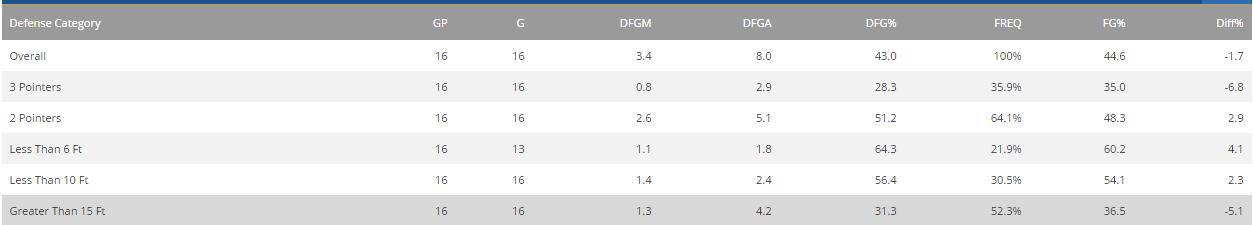
While Vasquez actually is playing better shot defense on two-pointers and shots closer to the rim than DeRozan was, he is struggling relative to DeRozan as far as guarding the three point line. Opponents shoot 9.9% higher than their season average on 3-pointers when Vasquez is their primary defender. With DeRozan as the primary defender, opponents shot 6.8% worse from three point range. Because 3-pointers drive up effective field goal percentage, Vasquez’s inability to defend the perimeter as well as DeRozan does is, statistically, an issue.
One option for head coach Dwane Casey might be to start a longer lineup – with Terrence Ross at shooting guard and James Johnson at small forward. Casey has used a lineup that does this from time to time in DeRozan’s absence and the results as it relates to eFG% are very good. Opponents are rebounding at a much higher rate with this lineup, but that is more than offset by the other factors.
| Lineup | Opp eFG% | Opp FTA Rate | Opp TO Ratio | Opp OREB% |
| PG: LowrySG: VasquezSF: RossPF: A. JohnsonC: Valanciunas | 57.2% | 0.234 | 12.1 | 24.5% |
| PG: LowrySG: RossSF: J. JohnsonPF: A. JohnsonC: Valanciunas | 34.5% | 0.172 | 11.9 | 45.0% |
Another interesting thing to look at on a team level in terms of the “Four Factors” is that the Raptors’ ability to force turnovers has decreased dramatically since DeRozan’s absence. While DeRozan’s on court/off court splits showed only a small increase in opponent turnover rate from 17.3% to 18.0% (increase here means more turnovers for opponents, which is good for the Raptors), the team has struggled in this area in his absence.
| Games | Opponent Turnover Rate (rk) – lower means fewer opponent turnovers which is worse for the Raptors |
| Games 1-16 (pre DeRozan injury) | 17.6 (3rd) |
| Games 17-22 (post DeRozan injury | 12.8 (25th) |
This translates to roughly three fewer turnovers forced per game. In a close game – two of the Raptors’ three losses during this stretch were by seven points or fewer – that could have potentially been the difference between winning and losing.
There were two key things I noticed when sifting through the data. The first is that for the guards, opponent turnover rates when each guard is in the game are down in general are down across the board if you look at the splits. It could be that with one fewer player, those that are getting more minutes are expending more energy and perhaps don’t have that extra step needed to cut off the passing lane. This is where Lou Williams has perhaps been the most disappointing – he was 8th in the NBA this season prior to the DeRozan injury with an average of 2.6 steals per 36 minutes. Since then he has only averaged 0.8 steals per 36 minutes.
Raptors Opponent Turnover Ratings by Guard When On Court – Pre/Post DeRozan Injury
Higher Turnover Rating = More Opponent Turnovers = Good
| Lowry | Vasquez | Ross | Williams | |
| Games 1-16 (pre DeRozan injury) | 16.4% | 19.4% | 14.7% | 21.1% |
| Games 17-22 (post DeRozan injury | 13.4% | 12.3% | 12.5% | 11.4% |
The second is the decrease in playing time for Tyler Hansbrough (from 17.6 to 6.2 minutes per game) and Chuck Hayes (from 10.7 to 7.4 minutes per game). Two of the best lineups in terms of forcing opponent turnovers prior to the DeRozan injury had Hansbrough at center. And statistically this season, the Raptors force turnovers at a much higher rate when Hayes or Hansbrough are in the game, even following the DeRozan injury.
Raptors Opponent Turnover Ratings – Pre DeRozan Injury
Higher Turnover Rating = More Opponent Turnovers = Good
| On Court | Off Court | |
| Hayes | 17.8% | 17.5% |
| Hansbrough | 23.5% | 15.6% |
Raptors Opponent Turnover Ratings – Post DeRozan Injury
Higher Turnover Rating = More Opponent Turnovers = Good
| On Court | Off Court | |
| Hayes | 19.6% | 12.3% |
| Hansbrough | 15.1% | 12.5% |
I think the points in this article are prime examples of where the advanced analytics can help teams. It’s no secret the Raptors defense has been bad since DeRozan’s injury. Dis-aggregating the information into digestible chunks allows you to keep the information in plain enough English that it can be understood and then coached appropriately.
Eric Goodman is a basketball data enthusiast based out of New York. Follow him on twitter at @ericdgoodman36 and atdataballgoodman.blogspot.com.